Table of Contents
***New Knowledge base COMING SOON!!! #
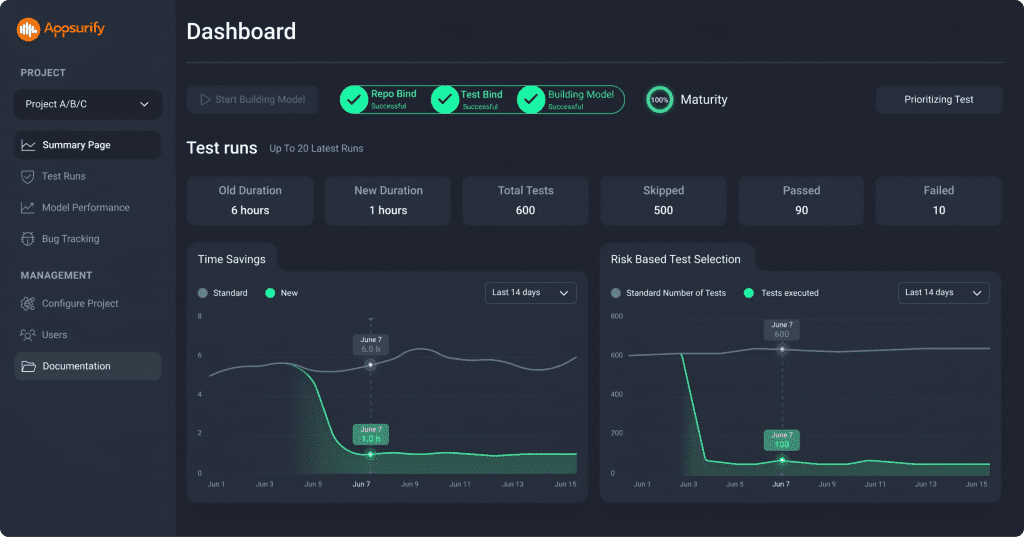
Dashboard Actions #
Each Project has it’s own Dashboard where Admins can:Each Project has it’s own Dashboard where Admins can:
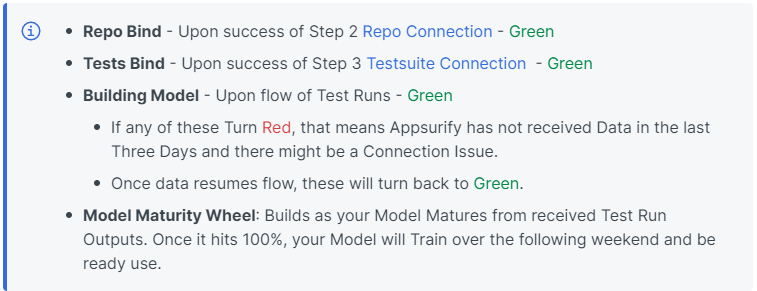
- Follow the Health and Integration for the Project to Optimize.
- Gain insight into the Maturity of their Model for the active Project via the “Maturity Wheel”
- Visibility into the Value Appsurify brings through the “Time Savings” and “Risk Based Test Selection” Graphs.
Dashboard Insights #
The Dashboard serves as the Central Hub for the project overall. Provides the team with meaningful insights into:
- Visual Display of Value generated from AI-Powered Risk Based Testing via “Time Savings” an “Risk Based Test Selection” Graphs:
- High water mark serves as the “Before” or “Without” Appsurify.
- Once Appsurify is enabled, Green lower line serves as the Value generated through Appsurify’s Optimization for Time and Test Selection Execution.
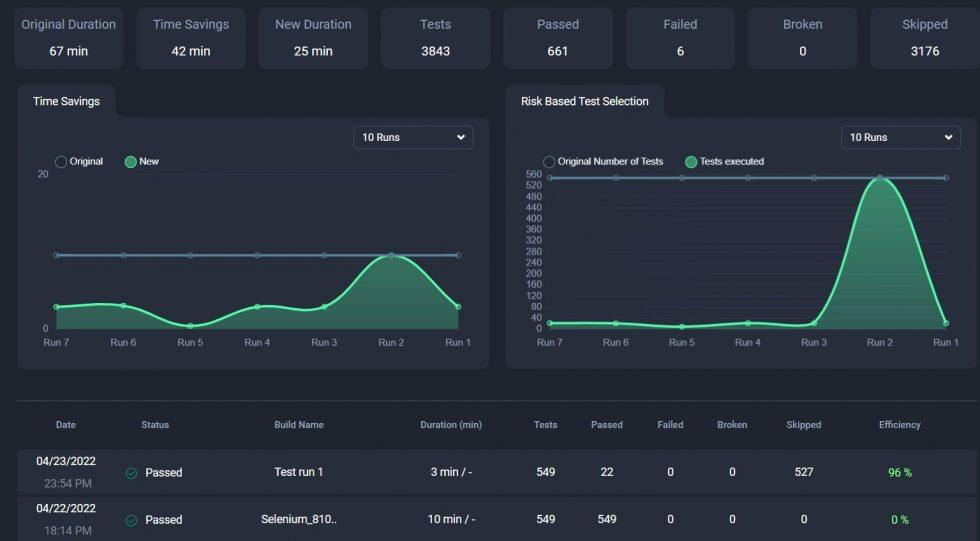
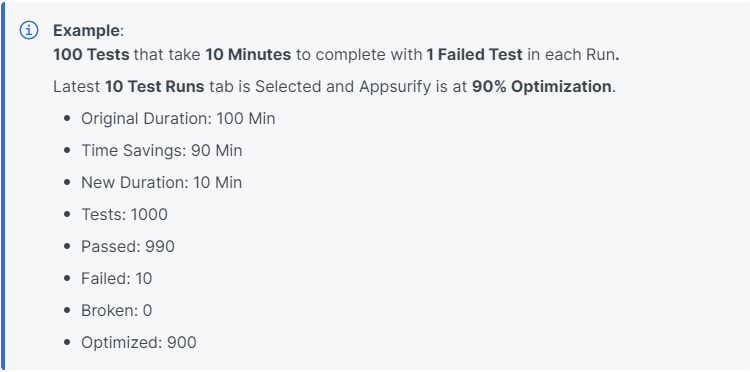
Horizontal Boxes Defined: #
- Original Duration: Total original Time it takes for ALL TESTS (100% of Testsuite) to complete.
- Time Savings – Total Time Saved through Prioritized Testing
- Difference between Original Duration and New Duration.
- New Duration – Total new Time of optimized Test Run execution.
- Tests: Total number of Tests in testsuite.
- Passed: Total number of Tests Passed.
- Failed: Total number of Tests Failed.
- Broken: Total number of Broken Tests or Failed to run
- Optimized: Total number of Tests Appsurify decided were irrelevant given recent Developer Changes and chose Not To Run for optimization purposes.
Test Run Summary at Bottom Defined #
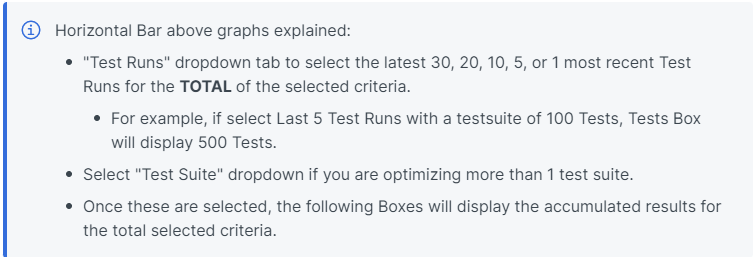
The latest 20 Test Runs are displayed with their individual characteristics on a per run basis:
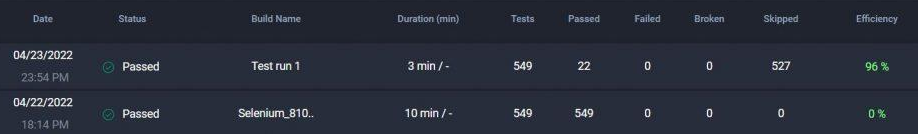
- Date: Time stamp
- Status: Build either Passed or Failed
- Build Name: Name of the Build for reference.
- Duration: Duration of Run (factoring in Optimization or not)
- Tests: Total number of Tests in Testsuite (this should not change too much, only if adding tests to testsuite)
- Passed: Number of Tests that Passed
- Failed: Number of Tests Failed
- Broken: Number of Tests Broken or Failed to Run
- Optimized: Number of Tests that Appsurify’s AI chose not to run due to them being irrelevant to the areas where Developers made changes.
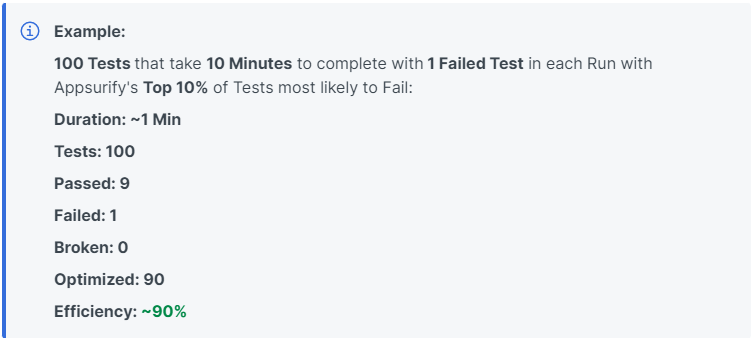
- Efficiency: If Optimization is engaged – at what efficiency was the Test Run executed at.
- For example, if Appsurify is Executing the Top 10% of Tests, Efficiency should hover around the ~90% Efficiency Mark.
- If Appsurify is not yet enabled, Efficiency should hover around ~0%.
How do we TRUST these Results!
#
In the Your Model Insights Page! #
Insights Model Page Link Here.


